Place names from the United States of America are sourced from the United States Geological Survey (USGS) Geographic Names Information System (GNIS) at http://geonames.usgs.gov/ [USG06].
For the rest of the world, toponymic information is based on the Geographic Names Data Base, containing official standard names approved by the United States Board on Geographic Names and maintained by the National Geospatial-Intelligence Agency. More information is available at the Products and Services link at www.nga.mil. The National Geospatial-Intelligence Agency name, initials, and seal are protected by 10 United States Code Section §445.
The sunrise and sunset times are calculated using a PHP script using formulae from www.srrb.noaa.gov [NOA06]. The times given do not currently automatically take account of daylight saving time (summer time). To take DST into account, make sure the "DST" box is checked.
Resolution and Accuracy
The terrain model used to find heights above sealevel is from the Shuttle Radar Topography Mission (SRTM) [USG04] which was a joint project between the US National Geospatial-Intelligence Agency (NGA) and the National Aeronautics and Space Administration (NASA). Data was recorded for 11 days from the Space Shuttle Endevour from 11th February 2000. The data used here is at a resolution of 3 arc seconds (approximately 90m).
Coverage
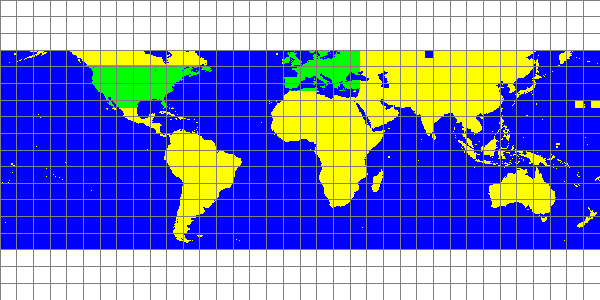
Current height data coverage includes all of mainland Europe (between latitudes 35°N and 60°N and longitudes 35°E and 15°W) and all of the contiguous states of the United States of America (between latitudes 20°N and 50°N and longitudes 65°W and 125°W). I intend to extend the coverage of that data to the rest of the world (as and when the space available for hosting increases to hold the data!).
The following map shows the coverage. Blue shows areas with no height data (normally sea/ocean); yellow shows areas with height data that isn't available on EarthTools; green shows areas with height data that is available on EarthTools.
Contour maps have been produced for some parts of the world in order to show terrain. They are available by clicking the "Contour" button in the top-left of the map display - this will activate the contour layer. Note that coverage is currently limited (see below). The interval between contours is shown at the bottom-left of the map display.
Most contours are derived from the same SRTM data as used for the height tool. Where SRTM data is poor and contains voids, I have used data provided by Jonathan de Ferranti who is working through filling these voids and extending the coverage provided by SRTM. You can read more about this on his website. Many thanks to Jonathan for providing this data.
Main areas covered by Jonathan's infill data include Scandinavia, Iceland, the Alps, Himalayas, Andes and parts of northern Russia.
For the United States, I am gradually replacing the 3-arc-second SRTM data in my database with 1-arc-second data from the National Elevation Dataset (NED). This will provide much better resolution and accuracy. I have already included NED data for areas such as the Grand Canyon and much of the Rocky Mountains. Similar data is available for Mexico and Canada which will be added in the future.
Data for Canada is provided by the Canadian Digital Elevation Data (CDED). This provides coverage for most of Canada at up to 0.75×0.75 arc second resolution (1.5"×0.75" between 68°N and 80°N and 3"×0.75" above 80°N). Note that this dataset is not complete for the whole of Canada, but these void areas are limited to the Northwest Territories, Nunavut and the far north of Québec.
How Were The Maps Generated?
To produce the contour maps, a linear interpolation contour approximation algorithm was used [SNY78]. The algorithm was implemented in Java and the maps systematically plotted. Once each 256x256 pixel tile was generated, an alpha layer was added to make the tiles transparent.
To make the process more efficient (and to reduce the need for storage and computation time), I only generate contour maps for areas that have been looked at. The first time someone looks at contour maps for an unprocessed area and zoom level, they won't see anything. However, that viewing was recorded and should be processed within 24 to 48 hours. I can't generate the maps in realtime as the process is too slow (typically between 1 second and half an hour, depending on the complexity of the tile).
Copyright
The contour maps are © 2006, earthtools.org.
Resolution and Accuracy
Data is provided at a resolution of 2.5 arc minutes per data point. Accuracy is reasonable but errors may be apparent close to the boundaries between time zones owing to the manner in which the data was sourced. The given local time does not yet take daylight saving time into account - I hope to add this functionality at a later date.
Coverage
Time Zone data is available for the whole world.
Copyright
Time Zone data is © 2006, earthtools.org.